Coordinates: Y = 399541 m, X = 45592 m, height above sea level: 56 m
The coordinates are in the Slovenian national coordinate system (D96/TM).
Height above ground level: 10 m
ID: 2252
The time print
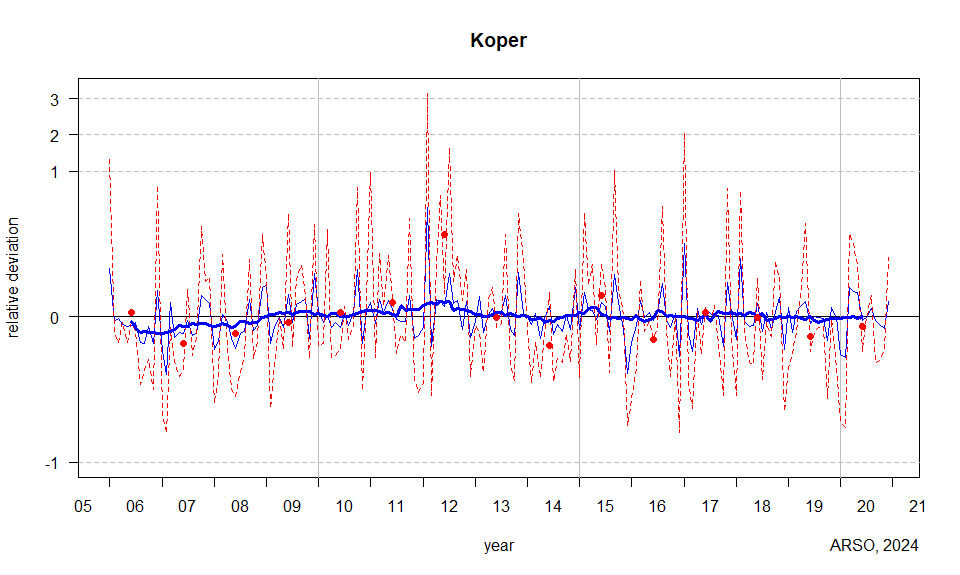
The graph illustrates the relative monthly deviation of speed and the cube of speed (power density). For each month in the period, the average speed and the cube of speed are calculated and subtracted from each month's value. The relative deviation of speed is depicted by a thin, jagged blue line, while the relative deviation of the cube of speed is shown with a red line. The smoother, thicker blue line represents the year-by-year relative deviation from the period's average. Red circles indicate the annual deviation of the cube of speed from the average cube of speed for the period. The vertical scale is linear, ranging from –1 to 1, with larger and smaller deviations compressed.
Average wind speed (m/s)
jan
feb
mar
apr
may
jun
jul
aug
sep
oct
nov
dec
year
2011
2.2
2.3
2.8
2.2
2.3
2.1
2.0
1.9
2.0
2.3
1.7
1.7
2.1
2012
1.8
4.2
2.0
2.3
2.3
2.1
2.7
2.2
2.3
1.9
2.2
1.7
2.3
2013
1.9
2.7
2.3
2.1
2.2
1.9
2.1
2.3
1.9
1.8
2.6
2.0
2.2
2014
2.0
2.3
2.6
1.8
2.0
2.1
1.8
1.9
1.9
2.1
1.8
2.3
2.0
2015
1.8
2.8
2.7
2.2
2.0
2.2
2.2
1.8
2.7
2.2
1.8
1.2
2.1
2016
1.6
2.3
2.8
2.1
2.1
1.9
2.1
2.5
2.0
1.9
2.1
1.4
2.1
2017
2.9
2.1
1.9
2.2
1.9
2.1
2.1
2.0
2.1
1.6
2.5
2.0
2.1
2018
1.7
3.4
2.5
2.0
1.9
2.2
1.8
2.1
1.9
2.1
2.3
1.5
2.1
2019
2.1
2.1
2.6
2.3
2.3
1.9
2.1
2.0
2.1
1.7
2.1
1.9
2.1
2020
1.4
1.7
3.1
2.5
2.4
1.9
2.0
2.1
2.0
1.9
1.8
2.1
2.1
average speed
1.9
2.6
2.5
2.2
2.1
2.0
2.1
2.1
2.1
2.0
2.1
1.8
2.1
Mean wind power density (W/m2)
jan
feb
mar
apr
may
jun
jul
aug
sep
oct
nov
dec
year
2011
40.6
23.0
48.3
14.9
17.0
10.6
8.8
8.9
10.3
24.8
9.3
8.7
18.8
2012
11.0
135.4
15.1
19.2
22.0
10.8
31.2
12.6
17.9
16.6
21.4
10.8
26.5
2013
19.0
28.4
20.7
15.8
14.4
8.8
11.4
15.9
8.4
8.2
27.9
24.7
16.9
2014
18.2
17.1
27.3
8.1
10.6
10.9
6.6
7.3
8.6
12.8
11.2
24.1
13.6
2015
11.7
54.6
40.5
19.2
9.6
12.9
14.0
6.3
25.7
17.5
16.9
4.5
19.3
2016
8.6
20.4
41.7
12.6
11.5
8.0
10.7
17.8
11.2
8.7
16.4
3.6
14.3
2017
62.7
17.0
12.2
14.6
8.8
10.0
11.3
11.0
10.3
6.7
30.8
15.3
17.6
2018
9.2
60.2
30.3
9.5
7.9
11.9
6.7
9.7
11.0
20.1
20.9
6.3
16.7
2019
13.2
23.5
29.9
17.0
20.0
7.1
10.5
9.4
11.7
6.4
15.8
11.7
14.5
2020
5.6
7.5
52.7
20.9
16.2
7.2
11.7
11.7
8.6
10.2
12.6
25.1
16.0
average power density
20.0
39.0
31.9
15.2
13.9
9.8
12.3
11.0
12.4
13.2
18.3
13.5
17.4
Wind rose
Numbers around the circumference of the circle indicate the relative frequency of winds coming from each of the 16 directions, along with the average wind speed for those winds. The colors represent the cumulative relative frequency of wind speeds. Some higher wind speed classes may be so small that they might not be visible. 'Calm' is defined as wind with a speed less than or equal to 0.3 m/s.
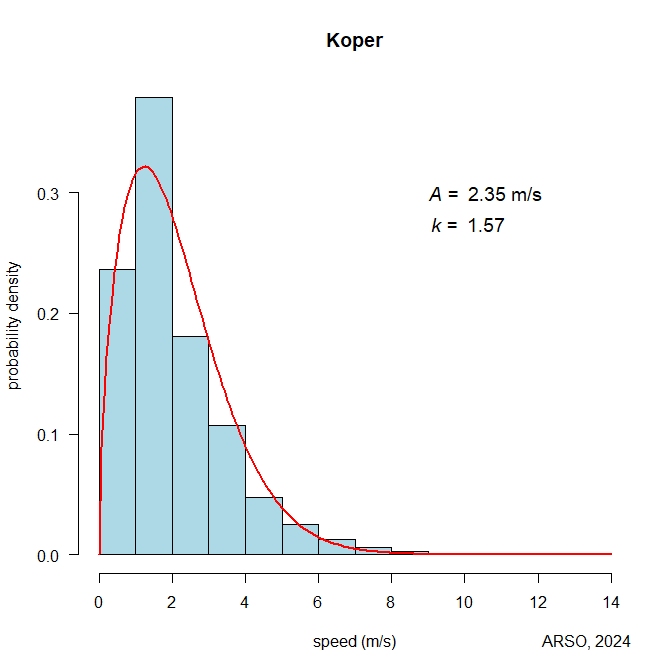
Distribution of wind speed
The graph displays the distribution of wind speed along with the fitted Weibull probability density distribution. The calculated Weibull distribution parameters, A (scale parameter) and k (shape parameter), are also presented.
Relative frequency of wind speed (%)
jan
feb
mar
apr
may
jun
jul
aug
sep
oct
nov
dec
year
≤ 1
32.9
20.8
21.5
22.0
18.6
18.5
18.7
19.0
17.4
24.4
26.9
32.7
22.8
1-2
38.1
32.4
30.0
34.8
38.0
39.0
38.5
38.2
41.5
41.7
37.4
41.2
37.6
2-3
11.6
16.2
18.3
19.7
22.8
23.3
21.3
21.8
22.0
17.8
14.0
11.8
18.4
3-4
6.3
10.6
12.2
13.9
13.2
15.0
15.7
15.0
11.7
8.2
8.8
5.9
11.4
4-5
4.9
7.0
7.0
5.6
4.2
3.1
3.7
4.2
4.5
4.1
6.3
3.8
4.8
5-6
3.2
5.7
4.7
2.5
1.8
0.8
1.2
1.3
1.8
2.2
3.6
2.1
2.6
6-7
1.3
3.0
3.0
1.0
0.8
0.1
0.4
0.4
0.7
0.9
1.8
1.2
1.2
7-8
0.7
1.9
1.6
0.3
0.4
0.0
0.2
0.1
0.2
0.4
0.9
0.7
0.6
8-9
0.3
1.1
0.9
0.1
0.1
0.0
0.1
0.0
0.1
0.1
0.2
0.2
0.3
9-10
0.3
0.6
0.4
0.0
0.1
0.0
0.1
0.0
0.0
0.1
0.0
0.1
0.1
10-11
0.2
0.4
0.2
0.0
0.0
0.0
0.0
0.0
0.0
0.1
0.0
0.0
0.1
11-12
0.1
0.1
0.0
0.0
0.0
0.0
0.0
0.0
0.0
0.0
0.0
0.0
0.0
12-13
0.0
0.1
0.0
0.0
0.0
0.0
0.0
0.0
0.0
0.0
0.0
0.0
0.0
> 13
0.0
0.0
0.0
0.0
0.0
0.0
0.0
0.0
0.0
0.0
0.0
0.0
0.0
calm
0.1
0.1
0.1
0.0
0.0
0.0
0.0
0.0
0.1
0.1
0.1
0.2
0.1
all
100.0
100.0
100.0
100.0
100.0
100.0
100.0
100.0
100.0
100.0
100.0
100.0
100.0
The unit of wind speed is m/s. Numbers may not add up to exactly 100 percent due to rounding. 'Calm' is defined as wind with a speed less than or equal to 0.3 m/s.
Relative frequency of wind directions (%)
≤ 1
1-2
2-3
3-4
4-5
5-6
6-7
7-8
8-9
9-10
10-11
> 11
all
N
0.7
0.7
0.1
0.0
0.0
0.0
0.0
0.0
0.0
0.0
0.0
0
1.4
NNE
0.6
0.7
0.2
0.0
0.0
0.0
0.0
0.0
0.0
0.0
0.0
0
1.4
NE
0.6
0.7
0.7
0.6
0.4
0.2
0.1
0.0
0.0
0.0
0.0
0
3.4
ENE
0.7
0.8
1.2
1.5
1.4
1.1
0.6
0.3
0.2
0.1
0.1
0
7.9
E
1.0
1.5
2.0
2.1
1.5
0.8
0.4
0.2
0.1
0.0
0.0
0
9.7
ESE
1.8
3.3
2.1
0.9
0.2
0.0
0.0
0.0
0.0
0.0
0.0
0
8.3
SE
4.1
9.0
1.7
0.5
0.3
0.2
0.1
0.1
0.0
0.0
0.0
0
16.0
SSE
4.4
8.5
1.0
0.6
0.4
0.1
0.0
0.0
0.0
0.0
0.0
0
15.1
S
1.7
2.1
0.8
0.5
0.2
0.0
0.0
0.0
0.0
0.0
0.0
0
5.4
SSW
0.8
1.1
0.9
0.3
0.1
0.0
0.0
0.0
0.0
0.0
0.0
0
3.2
SW
0.7
0.6
0.4
0.1
0.0
0.0
0.0
0.0
0.0
0.0
0.0
0
1.8
WSW
0.8
0.6
0.2
0.0
0.0
0.0
0.0
0.0
0.0
0.0
0.0
0
1.7
W
1.5
1.6
0.7
0.4
0.1
0.0
0.0
0.0
0.0
0.0
0.0
0
4.3
WNW
1.6
2.4
2.0
1.5
0.2
0.0
0.0
0.0
0.0
0.0
0.0
0
7.8
NW
1.0
2.8
4.0
2.3
0.1
0.0
0.0
0.0
0.0
0.0
0.0
0
10.2
NNW
0.8
1.3
0.4
0.0
0.0
0.0
0.0
0.0
0.0
0.0
0.0
0
2.5
calm
0.0
0.0
0.0
0.0
0.0
0.0
0.0
0.0
0.0
0.0
0.0
0
0.1
all
22.8
37.6
18.4
11.4
4.8
2.6
1.2
0.6
0.3
0.1
0.1
0
100.0
The unit of wind speed is m/s. Numbers may not add up to exactly 100 percent due to rounding. 'Calm' is defined as wind with a speed less than or equal to 0.3 m/s.
Average daily variation of the wind speed (m/s)
jan
feb
mar
apr
may
jun
jul
aug
sep
oct
nov
dec
year
1
1.9
2.3
2.1
1.6
1.7
1.5
1.5
1.5
1.7
1.8
2.0
1.7
1.8
2
1.9
2.4
2.1
1.6
1.6
1.5
1.5
1.5
1.7
1.8
2.0
1.8
1.8
3
1.8
2.3
2.1
1.7
1.7
1.5
1.6
1.6
1.7
1.8
2.0
1.8
1.8
4
1.8
2.4
2.1
1.7
1.7
1.5
1.6
1.6
1.7
1.8
2.0
1.8
1.8
5
1.8
2.4
2.1
1.8
1.7
1.5
1.6
1.6
1.8
1.7
2.0
1.7
1.8
6
1.8
2.4
2.1
1.7
1.6
1.5
1.5
1.6
1.8
1.7
2.0
1.8
1.8
7
1.9
2.4
2.1
1.7
1.6
1.6
1.6
1.6
1.8
1.7
2.1
1.8
1.8
8
1.8
2.4
2.2
1.8
1.8
1.7
1.7
1.7
1.8
1.8
2.1
1.7
1.9
9
1.8
2.4
2.3
2.0
2.2
2.0
2.1
1.9
1.9
1.8
2.1
1.7
2.0
10
1.8
2.5
2.7
2.5
2.5
2.4
2.5
2.3
2.2
1.9
2.1
1.7
2.3
11
1.9
2.7
3.1
2.9
2.9
2.7
2.9
2.7
2.6
2.2
2.3
1.8
2.6
12
2.1
3.0
3.4
3.2
3.1
3.0
3.2
3.1
2.9
2.4
2.4
1.9
2.8
13
2.3
3.2
3.7
3.3
3.2
3.1
3.3
3.2
3.0
2.6
2.6
2.0
3.0
14
2.4
3.3
3.6
3.2
3.2
3.2
3.3
3.3
3.0
2.6
2.6
2.1
3.0
15
2.4
3.3
3.5
3.1
3.0
3.0
3.2
3.2
2.9
2.5
2.5
2.0
2.9
16
2.1
3.1
3.2
2.9
2.8
2.9
3.1
3.0
2.8
2.3
2.2
1.8
2.7
17
1.9
2.8
2.9
2.6
2.5
2.6
2.8
2.7
2.5
2.0
2.0
1.7
2.4
18
1.8
2.5
2.5
2.2
2.3
2.3
2.4
2.3
2.1
1.8
1.9
1.7
2.1
19
1.8
2.4
2.3
1.9
1.9
1.9
1.9
1.8
1.8
1.7
1.9
1.7
1.9
20
1.8
2.5
2.2
1.8
1.7
1.6
1.5
1.5
1.7
1.8
1.9
1.7
1.8
21
1.9
2.4
2.2
1.7
1.6
1.5
1.4
1.5
1.8
1.8
1.9
1.7
1.8
22
1.9
2.4
2.2
1.7
1.6
1.5
1.5
1.5
1.8
1.8
2.0
1.8
1.8
23
1.9
2.5
2.1
1.6
1.6
1.5
1.4
1.5
1.8
1.8
1.9
1.7
1.8
24
1.9
2.5
2.1
1.6
1.7
1.5
1.5
1.5
1.7
1.8
2.0
1.8
1.8
average speed
1.9
2.6
2.5
2.2
2.1
2.0
2.1
2.1
2.1
2.0
2.1
1.8
2.1
The value of an hour indicates the end of a one-hour measurement interval. For example, the value 1 represents the period from midnight to 1 a.m., and the value 15 represents the period from 2 p.m. to 3 p.m. The time shown is Central European Time (CET).
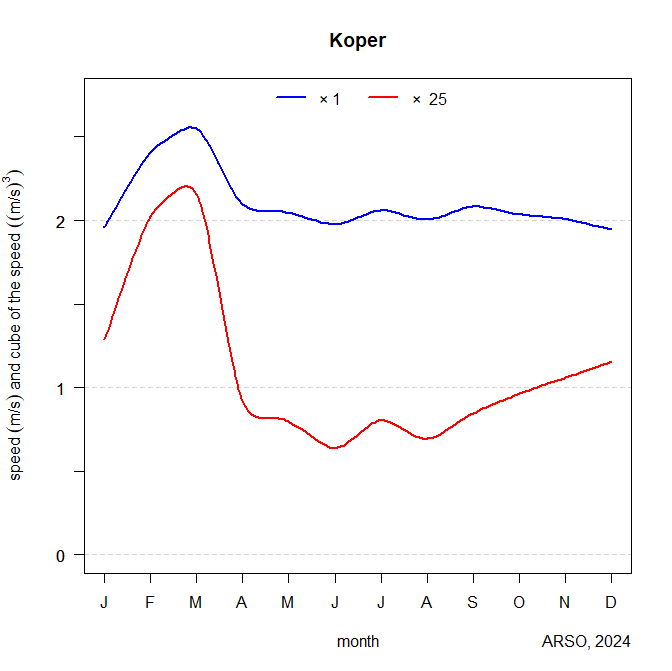
Mean year
The graph shows the average seasonal variations of wind speed (blue line) and the cube of wind speed (red line). The cube of the average speed is proportional to the average wind power density. The unit on the ordinate is m/s for the average speed and m3/s3 for the average cube of wind speed. Values read from the graph should be multiplied by the scale factor provided at the top of the graph.
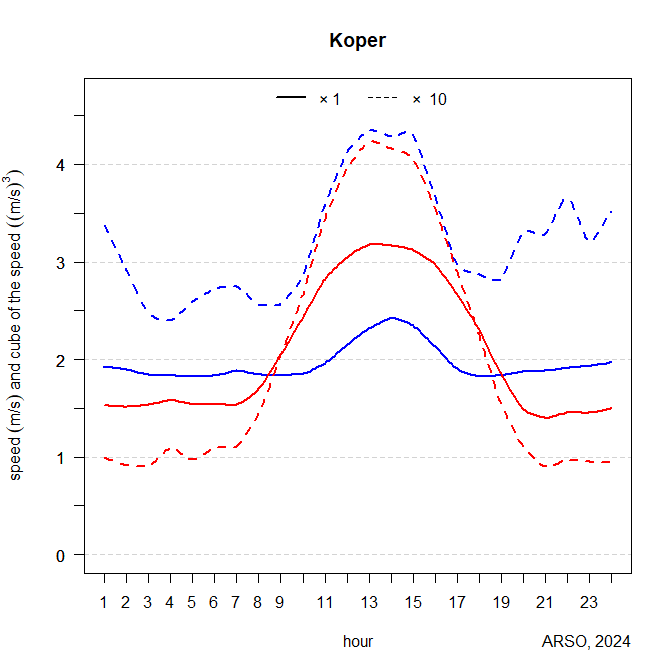
Mean day
The graph shows the average daily variations of wind speed for January (blue lines) and July (red lines). The cube of the average speed is proportional to the average wind power density. The average daily variations of wind speed are depicted with solid lines, while the average cubes of wind speed are shown with dashed lines. The unit on the ordinate is m/s for the average speeds and m3/s3 for the average cubes of speed. Values read from the graph should be multiplied by the scale factor provided at the top of the graph. The time shown is Central European Time (CET).