Coordinates: Y = 386793 m, X = 45891 m, height above sea level: 0 m
The coordinates are in the Slovene national coordinate system (D48/GK).
Height above ground level: 5 m
The time print
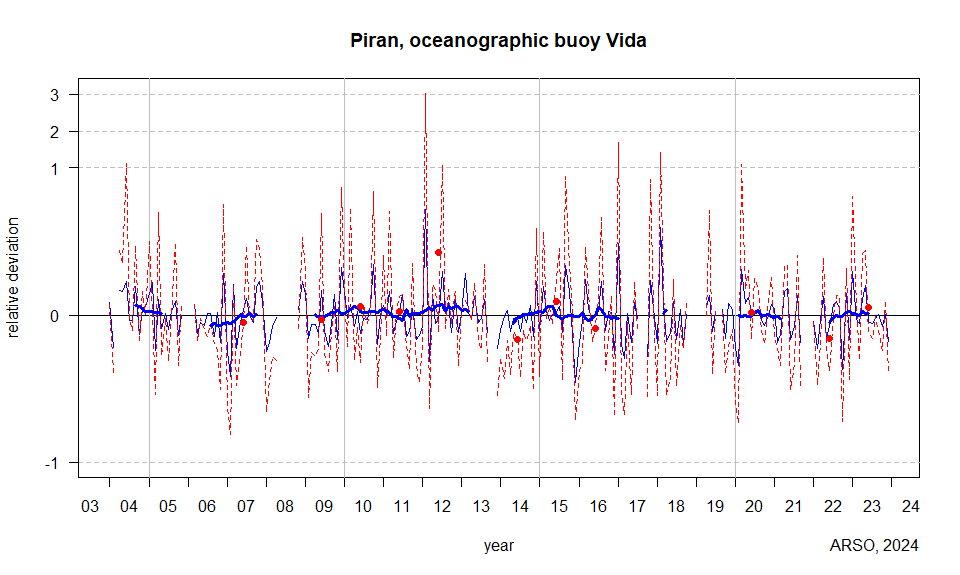
The graph shows the relative monthly deviation of speed and cube of speed (power density). For each month of the period the average speed and cube of speed are calculated and substracted from each month's value. The relative deviation of speed is shown with thin jagged blue line and with red line the relative deviation of the cube of speed is shown. The smoother and thicker blue line shows the year by year relative deviation from the average of the period. The red circles show annual deviation of the cube of speed from the average cube of speed of the period. The vertical scale is linear from values between –1 and 1, larger and smaller deviations are compressed.
Average wind speed (m/s)
jan
feb
mar
apr
may
jun
jul
aug
sep
oct
nov
dec
year
2004
5.0
4.0
—
4.9
4.8
4.7
3.6
3.8
5.6
4.2
5.0
5.1
4.6
2005
5.3
6.3
3.7
4.6
3.8
3.9
3.4
4.0
5.1
4.2
4.8
—
4.6
2006
—
—
5.2
3.7
3.9
3.6
3.8
4.0
4.0
5.0
3.9
6.2
4.3
2007
3.5
3.0
5.8
3.2
4.0
4.0
4.2
3.9
4.4
5.8
5.9
5.3
4.4
2008
3.5
4.2
4.5
4.1
—
—
—
—
—
—
5.0
5.9
4.5
2009
5.3
4.4
4.5
3.9
3.6
4.5
3.4
3.1
4.4
5.6
4.0
6.4
4.4
2010
5.4
5.1
5.2
3.9
4.3
3.4
3.7
3.8
5.0
6.6
3.9
4.9
4.6
2011
4.9
5.2
5.6
3.7
4.0
3.9
4.3
3.3
4.1
5.1
4.0
4.2
4.4
2012
4.3
8.9
3.3
4.8
3.9
3.7
4.9
4.0
5.1
4.3
5.4
4.3
4.7
2013
4.7
6.6
4.9
4.0
4.7
3.7
3.7
4.3
4.1
—
—
3.7
4.6
2014
4.2
5.1
5.0
3.7
4.0
3.8
3.4
3.9
4.4
5.2
4.1
5.9
4.4
2015
4.1
6.2
4.9
4.0
4.2
3.9
4.0
3.4
6.2
5.7
4.2
2.6
4.4
2016
3.7
5.0
6.0
4.4
4.0
3.9
3.9
4.8
4.2
5.0
4.9
3.5
4.4
2017
6.8
4.2
3.4
4.2
3.4
4.2
3.7
—
—
3.5
6.0
5.0
4.4
2018
3.7
8.2
5.2
3.4
3.6
4.2
3.2
4.1
3.8
4.9
—
—
4.4
2019
—
—
—
4.4
4.7
3.4
3.9
—
4.8
4.1
5.2
5.0
4.4
2020
3.6
3.4
6.3
4.5
4.6
3.9
3.8
4.0
4.5
4.5
4.8
5.2
4.4
2021
4.8
4.2
4.2
4.8
4.9
3.2
3.5
4.4
3.8
—
—
—
4.3
2022
4.4
4.0
4.7
4.7
3.5
3.5
4.1
4.3
4.9
3.1
5.5
4.0
4.2
2023
6.0
5.0
4.5
4.6
5.0
3.7
3.6
3.8
4.7
4.5
4.8
4.0
4.5
average speed
4.6
5.2
4.8
4.2
4.1
3.8
3.8
3.9
4.7
4.9
4.8
4.8
4.5
Mean wind power density (W/m2)
jan
feb
mar
apr
may
jun
jul
aug
sep
oct
nov
dec
year
2004
239.3
183.9
—
181.7
146.6
177.8
84.9
82.4
221.2
161.0
241.3
231.9
177.4
2005
338.4
308.1
103.8
214.7
78.2
81.6
59.6
92.9
225.2
129.4
228.0
—
190.6
2006
—
—
239.1
104.8
105.5
76.0
73.5
87.1
120.0
149.9
102.5
402.1
150.3
2007
85.5
56.1
264.0
64.9
79.0
76.9
127.4
92.2
145.1
301.1
304.8
279.1
155.8
2008
74.9
169.7
160.2
87.2
—
—
—
—
—
—
189.2
353.4
167.9
2009
290.7
131.6
165.7
89.8
81.9
140.5
63.8
56.4
132.0
211.0
127.7
434.1
162.3
2010
255.3
237.3
390.6
87.1
98.4
56.6
92.9
86.9
149.4
366.9
106.6
194.4
177.2
2011
314.5
258.2
380.8
89.5
110.4
93.4
98.9
72.2
93.8
269.5
134.0
125.9
170.7
2012
177.9
1242.0
81.5
151.8
127.6
73.2
181.0
83.4
176.0
188.4
238.7
151.5
234.9
2013
229.5
331.3
234.6
120.8
131.0
69.8
65.9
123.5
99.4
—
—
102.6
163.0
2014
156.5
168.7
180.6
74.4
96.1
70.3
50.4
82.8
123.7
184.4
100.0
366.8
138.1
2015
129.1
471.6
215.2
133.1
101.2
104.1
125.2
50.9
292.3
264.3
214.9
64.5
178.1
2016
136.9
201.3
323.3
145.4
88.3
76.2
95.5
152.9
92.9
171.0
235.8
71.0
148.8
2017
604.0
141.6
71.1
119.1
49.5
101.2
76.3
—
—
88.2
400.6
235.1
183.5
2018
100.6
736.4
267.5
56.7
60.1
102.6
44.7
86.3
115.3
213.6
—
—
169.1
2019
—
—
—
124.9
186.7
48.7
89.2
—
155.4
119.6
159.5
207.1
135.9
2020
90.5
79.2
464.5
147.3
140.1
69.3
108.2
108.6
132.6
158.2
228.2
288.0
168.6
2021
188.5
234.0
146.6
168.5
144.3
40.8
57.2
129.4
78.1
—
—
—
146.5
2022
210.9
156.3
178.9
175.0
82.1
51.1
84.6
103.3
168.6
53.6
273.8
129.8
138.6
2023
400.4
323.6
152.5
180.0
155.2
72.1
72.6
91.4
133.0
148.3
226.2
138.4
173.5
average power density
223.0
302.9
222.2
125.9
107.9
83.0
86.4
92.0
150.1
198.1
207.9
230.6
167.3
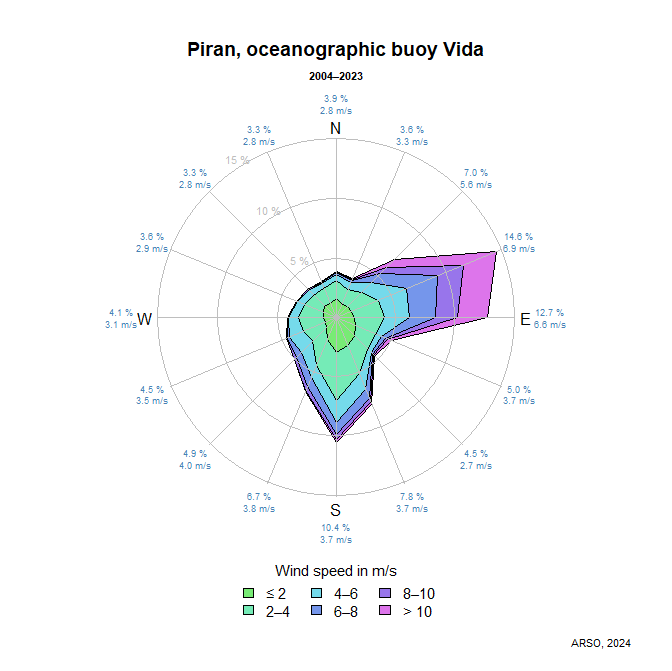
Wind rose
Numbers at the circumference of the circle show the relative frequency of winds coming from each of 16 directions and the average wind speed of those winds. The colours show the cumulative relative frequency of the wind speed. Some higher wind speed classes can be so small that they might not be visible. Calm is defined as wind with speed less or equal 0.3 m/s.
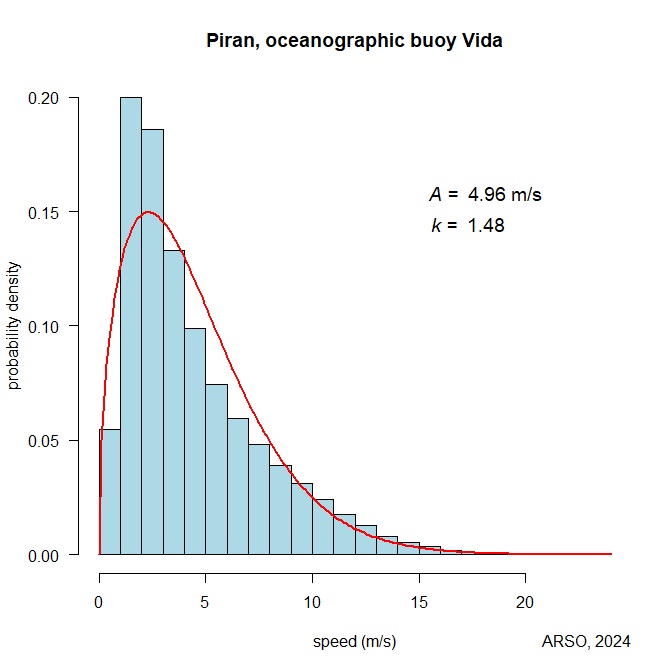
Distribution of wind speed
The graph shows the distribution of wind speed and fitted Weibull probability density distribution. The calculated Weibull ditribution parameters A (scale parameter) and k (shape parameter) are also presented.
Relative frequency of wind speed (%)
jan
feb
mar
apr
may
jun
jul
aug
sep
oct
nov
dec
year
≤ 1
5.9
6.2
6.4
5.7
4.8
5.3
5.5
5.9
4.7
5.3
4.7
5.1
5.5
1-2
22.1
20.9
19.8
20.4
18.7
20.3
21.8
20.3
17.2
18.7
18.8
20.8
20.0
2-3
20.3
16.4
16.2
18.6
18.8
20.0
21.3
19.9
16.3
16.4
18.9
19.7
18.6
3-4
12.3
10.5
11.1
14.3
15.0
16.0
15.7
15.4
12.9
11.3
12.7
11.5
13.3
4-5
7.8
7.1
9.2
10.9
12.2
12.9
11.4
11.3
10.1
8.6
8.7
7.6
9.9
5-6
5.0
5.5
6.9
8.0
9.2
8.9
7.9
8.3
9.3
7.6
7.1
5.6
7.5
6-7
4.1
5.2
6.0
6.5
7.3
6.0
5.5
6.5
7.6
6.6
5.3
4.8
6.0
7-8
3.9
4.9
5.5
4.7
5.2
4.2
3.7
4.5
6.8
5.7
4.4
4.6
4.8
8-9
3.6
4.6
4.9
3.4
3.4
2.6
2.6
2.9
5.4
5.4
4.3
4.0
3.9
9-10
3.4
4.4
3.7
2.7
2.1
1.6
1.8
1.9
3.6
4.5
4.1
3.7
3.1
10-11
2.9
3.7
3.0
1.8
1.3
1.0
1.2
1.1
2.6
3.6
3.7
3.5
2.4
11-12
2.6
3.2
2.2
1.1
0.9
0.5
0.7
0.8
1.4
2.7
2.5
3.0
1.8
12-13
2.1
2.1
1.7
0.8
0.6
0.3
0.4
0.5
0.9
1.8
1.8
2.3
1.3
13-14
1.4
1.5
1.2
0.5
0.3
0.1
0.2
0.2
0.5
1.0
1.3
1.6
0.8
14-15
1.1
1.2
0.8
0.3
0.2
0.1
0.2
0.1
0.2
0.5
0.8
1.1
0.5
15-16
0.8
1.0
0.6
0.1
0.1
0.1
0.1
0.0
0.1
0.3
0.5
0.6
0.3
16-17
0.4
0.6
0.4
0.1
0.0
0.0
0.0
0.0
0.1
0.1
0.2
0.3
0.2
17-18
0.1
0.5
0.1
0.1
0.0
0.0
0.0
0.0
0.0
0.1
0.1
0.1
0.1
18-19
0.1
0.3
0.1
0.0
0.0
0.0
0.0
0.0
0.0
0.0
0.0
0.0
0.1
19-20
0.0
0.2
0.1
0.0
0.0
0.0
0.0
0.0
0.0
0.0
0.0
0.0
0.0
20-21
0.0
0.1
0.0
0.0
0.0
0.0
0.0
0.0
0.0
0.0
0.0
0.0
0.0
> 21
0.0
0.0
0.0
0.0
0.0
0.0
0.0
0.0
0.0
0.0
0.0
0.0
0.0
calm
0.1
0.0
0.0
0.0
0.0
0.0
0.0
0.1
0.0
0.0
0.0
0.0
0.0
all
100.0
100.0
100.0
100.0
100.0
100.0
100.0
100.0
100.0
100.0
100.0
100.0
100.0
The unit of the wind speed is m/s. Numbers don't necessarily add up to exactly 100 percent due to rounding. Calm is defined as wind with speed less or equal 0.3 m/s.
Relative frequency of wind directions (%)
≤ 1
1-2
2-3
3-4
4-5
5-6
6-7
7-8
8-9
9-10
10-11
11-12
12-13
13-14
14-15
15-16
16-17
17-18
18-19
> 19
all
N
0.5
1.1
1.0
0.6
0.3
0.2
0.1
0.1
0.0
0.0
0.0
0.0
0.0
0.0
0.0
0.0
0.0
0.0
0.0
0
3.9
NNE
0.3
1.0
0.8
0.5
0.4
0.2
0.1
0.1
0.1
0.0
0.0
0.0
0.0
0.0
0.0
0.0
0.0
0.0
0.0
0
3.6
NE
0.3
1.0
0.9
0.7
0.6
0.6
0.5
0.5
0.4
0.3
0.3
0.2
0.2
0.1
0.1
0.1
0.0
0.0
0.0
0
7.0
ENE
0.3
1.1
1.3
1.2
1.2
1.3
1.4
1.4
1.3
1.1
1.0
0.7
0.5
0.3
0.2
0.1
0.1
0.0
0.0
0
14.6
E
0.3
1.2
1.4
1.1
1.0
1.1
1.1
1.1
1.0
0.9
0.7
0.6
0.4
0.3
0.2
0.1
0.1
0.0
0.0
0
12.7
ESE
0.3
1.5
1.2
0.6
0.3
0.2
0.2
0.2
0.1
0.1
0.1
0.1
0.1
0.0
0.0
0.0
0.0
0.0
0.0
0
5.0
SE
0.4
1.9
1.2
0.4
0.2
0.2
0.1
0.1
0.1
0.1
0.0
0.0
0.0
0.0
0.0
0.0
0.0
0.0
0.0
0
4.5
SSE
0.4
2.1
1.5
1.0
0.8
0.6
0.5
0.3
0.2
0.2
0.1
0.0
0.0
0.0
0.0
0.0
0.0
0.0
0.0
0
7.8
S
0.5
2.4
2.4
1.6
1.0
0.8
0.6
0.4
0.3
0.2
0.1
0.1
0.0
0.0
0.0
0.0
0.0
0.0
0.0
0
10.4
SSW
0.4
1.6
1.4
0.9
0.6
0.5
0.5
0.3
0.2
0.1
0.1
0.0
0.0
0.0
0.0
0.0
0.0
0.0
0.0
0
6.7
SW
0.3
0.8
0.8
0.8
0.8
0.6
0.4
0.2
0.1
0.0
0.0
0.0
0.0
0.0
0.0
0.0
0.0
0.0
0.0
0
4.9
WSW
0.3
0.7
0.9
1.1
0.8
0.4
0.1
0.1
0.0
0.0
0.0
0.0
0.0
0.0
0.0
0.0
0.0
0.0
0.0
0
4.5
W
0.3
0.8
1.0
1.0
0.6
0.2
0.1
0.0
0.0
0.0
0.0
0.0
0.0
0.0
0.0
0.0
0.0
0.0
0.0
0
4.1
WNW
0.3
0.9
1.0
0.7
0.4
0.2
0.1
0.0
0.0
0.0
0.0
0.0
0.0
0.0
0.0
0.0
0.0
0.0
0.0
0
3.6
NW
0.3
1.0
0.9
0.5
0.3
0.2
0.1
0.0
0.0
0.0
0.0
0.0
0.0
0.0
0.0
0.0
0.0
0.0
0.0
0
3.3
NNW
0.3
1.0
0.9
0.5
0.3
0.1
0.1
0.0
0.0
0.0
0.0
0.0
0.0
0.0
0.0
0.0
0.0
0.0
0.0
0
3.3
calm
0.0
0.0
0.0
0.0
0.0
0.0
0.0
0.0
0.0
0.0
0.0
0.0
0.0
0.0
0.0
0.0
0.0
0.0
0.0
0
0.0
all
5.5
20.0
18.6
13.3
9.9
7.5
6.0
4.8
3.9
3.1
2.4
1.8
1.3
0.8
0.5
0.3
0.2
0.1
0.1
0
100.0
The unit of the wind speed is m/s. Numbers don't necessarily add up to exactly 100 percent due to rounding. Calm is defined as wind with speed less or equal 0.3 m/s.
Average daily variation of the wind speed (m/s)
jan
feb
mar
apr
may
jun
jul
aug
sep
oct
nov
dec
year
1
4.6
5.4
4.7
3.8
3.9
3.6
3.6
3.7
4.7
5.0
4.8
4.9
4.4
2
4.6
5.3
4.7
3.8
3.9
3.6
3.7
3.8
4.7
4.9
4.8
4.9
4.4
3
4.6
5.2
4.7
3.9
3.9
3.6
3.7
3.9
4.7
4.9
4.7
5.0
4.4
4
4.6
5.1
4.7
4.0
3.9
3.6
3.6
3.9
4.6
5.0
4.8
4.9
4.4
5
4.6
5.1
4.7
4.1
3.9
3.6
3.7
3.9
4.6
4.9
4.8
4.9
4.4
6
4.6
5.1
4.7
4.1
3.9
3.6
3.7
3.9
4.7
4.9
4.8
4.9
4.4
7
4.7
5.0
4.7
4.1
3.9
3.5
3.6
3.9
4.7
5.0
4.9
4.9
4.4
8
4.7
5.1
4.7
4.0
3.8
3.4
3.4
3.7
4.6
4.9
4.9
4.9
4.3
9
4.7
5.0
4.7
3.9
3.8
3.4
3.3
3.5
4.4
4.8
4.9
4.9
4.3
10
4.7
4.9
4.7
4.1
3.9
3.5
3.3
3.5
4.3
4.6
4.8
4.9
4.3
11
4.6
4.9
4.8
4.3
4.2
3.8
3.6
3.7
4.4
4.5
4.7
4.8
4.3
12
4.5
4.9
5.0
4.7
4.6
4.2
4.0
4.0
4.6
4.6
4.7
4.6
4.5
13
4.6
5.1
5.3
4.9
4.9
4.6
4.4
4.3
4.8
4.9
4.8
4.7
4.8
14
4.6
5.2
5.4
4.9
5.0
4.8
4.6
4.6
4.9
5.0
4.8
4.7
4.9
15
4.6
5.2
5.4
4.9
4.9
4.8
4.7
4.6
4.9
5.0
4.8
4.7
4.9
16
4.5
5.3
5.2
4.8
4.7
4.7
4.5
4.5
5.0
5.0
4.7
4.7
4.8
17
4.5
5.2
5.1
4.5
4.5
4.4
4.3
4.3
4.9
4.9
4.7
4.6
4.7
18
4.5
5.1
4.9
4.2
4.3
4.0
4.0
4.1
4.7
4.8
4.7
4.7
4.5
19
4.6
5.1
4.7
4.0
4.1
3.7
3.6
3.8
4.5
4.8
4.8
4.8
4.4
20
4.6
5.2
4.6
3.9
3.9
3.6
3.4
3.6
4.5
5.0
4.9
4.8
4.3
21
4.6
5.3
4.6
3.9
3.9
3.5
3.4
3.6
4.6
5.1
5.0
4.9
4.3
22
4.7
5.4
4.7
3.8
4.0
3.6
3.5
3.7
4.7
5.0
5.0
4.9
4.4
23
4.7
5.4
4.7
3.8
3.9
3.6
3.6
3.7
4.7
5.0
5.0
4.9
4.4
24
4.7
5.5
4.6
3.7
4.0
3.5
3.6
3.7
4.7
5.1
4.9
4.9
4.4
average speed
4.6
5.2
4.8
4.2
4.1
3.8
3.8
3.9
4.7
4.9
4.8
4.8
4.5
The value of an hour marks the end of the one-hour measurement time interval. For example, the value 1 marks the period of time between midnight and 1 a. m., the value 15 marks the period of time between 2 p. m. and 3 p. m. The time shown is Central European Time (CET).
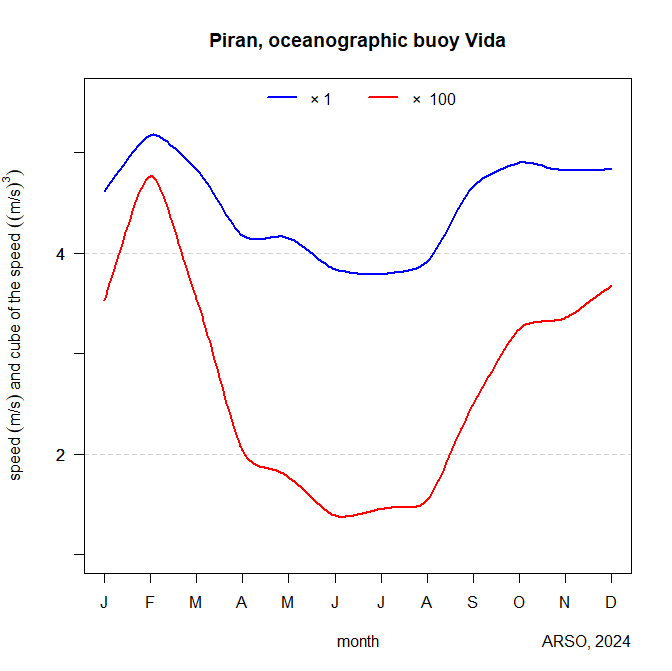
Mean year
In the graph the average seasonal variations of the wind speed (blue line) and cube of the wind speed (red line) are shown. The cube of the average speed is proportional to the average wind power density. The unit on the ordinate is m/s for the average speed and m3/s3 for the average cube of the wind speed. Values read from the graph should be multiplied by the scale factor given at the top of the graph.
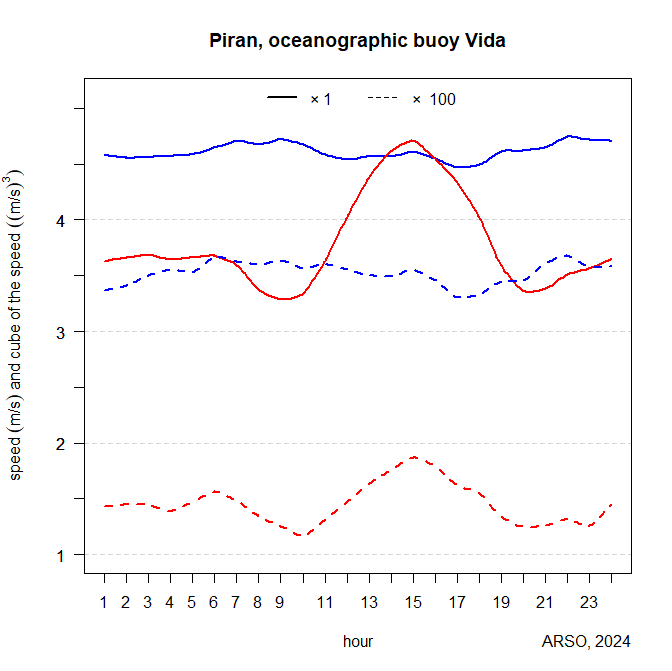
Mean day
In the graph average daily variations of the wind speed for January (blue lines) and July (red lines) are shown. The cube of the average speed is proportional to the average wind power density. The average daily variations of wind speed are shown in full lines and average cubes of wind speed are shown in dashed lines. The unit on the ordinate is m/s for the average speeds and m3/s3 for the average cubes of the speed. Values read from the graph should be multiplied by the scale factor given at the top of the graph. The time shown is Central European Time (CET).